|
Home \ Science \ Scientific Highlights
Scientific Highlights with the SMAThe Importance of the Magnetic Field from an SMA-CSO-Combined Sample of Star-Forming RegionsSubmillimeter dust polarization measurements of a sample of 50 star-forming regions, observed with the SMA and the CSO covering parsec-scale clouds to milliparsec-scale cores, are analyzed in order to quantify the magnetic field importance. The magnetic field misalignment δ—the local angle between magnetic field and dust emission gradient—is found to be a prime observable, revealing distinct distributions for sources where the magnetic field is preferentially aligned with or perpendicular to the source minor axis. Assuming the 50 sources to be representative, the prevailing source-magnetic field configuration is one that statistically prefers small magnetic field misalignments |δ|. When interpreting |δ| together with a magnetohydrodynamics force equation, as developed in the framework of the polarization–intensity gradient method, a sample-based log-linear scaling fits the magnetic field tension-to-gravity force ratio ⟨ΣB⟩ versus ⟨|δ|⟩ with ⟨ΣB ⟩ = 0.116 · exp(0.047 · ⟨|δ|⟩), providing a way to estimate the relative importance of the magnetic field, only based on measurable field misalignments |δ|. The force ratio ΣB discriminates systems that are collapsible on average (⟨ΣB ⟩ < 1) from other molecular clouds where the magnetic field still provides enough resistance against gravitational collapse (⟨ΣB⟩ > 1. ( Koch, Tang, Ho et al. 2014, ApJ in press, ADS )
|
>> INTERNAL DOCU | ASIAA

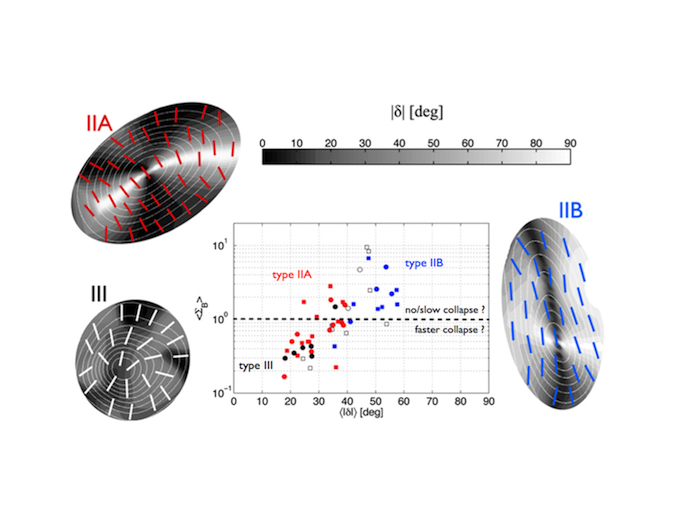 Source-averaged magnetic field tension-to-gravity force ratios, ⟨ΣB⟩, versus source-averaged misalignment angles, ⟨|δ|⟩, for the combined SMA and CSO samples of 50 star-forming regions. Red and blue filled symbols show the clearly identified IIA and IIB type sources from both the SMA (circles) and CSO (squares) sample. Empty symbols correspond to sources with less clear features. Black filled circles are the clearly identified SMA-III sources. Schematic magnetic field structures are illustrated for IIA (red segments), IIB (blue segments), and III type sources (white segments). White contours display the dust continuum emission. The black to white color grading on the top indicates the local misalignment |δ| between a magnetic field and a dust emission gradient orientation. Clear opposite trends are apparent for type IIA and IIB sources. All three schematic types are generated by over-gridding really observed sources (IIA, IIB: G240 and G35.2 from Zhang et al. (2014) and Qiu et al. (2013); III: W51 e2 from Tang et al. 2009). The systematic local changes in |δ| maps reflect changes in ΣB maps, which explains the observed correlation between ⟨ΣB ⟩ and ⟨|δ|⟩ across the two samples. The horizontal dashed line marks the force equilibrium between magnetic field tension and gravitational force. Above the dividing line the field tension is holding up against gravity, below the line gravity is dominating over field tension. The dividing line separates systems with, on average, no/slow collapse and faster collapse. In either case, local collapse and local star formation can be possible or hindered following local |δ| and ΣB patterns. On average, larger misalignment angles |δ| indicate a larger magnetic field resistance against gravity
©2016, Institute of Astronomy and Astrophysics, Academia Sinica, All Rights Reserved.
Last Updated: 2016-11-28 | Contact: web asiaa.sinica.edu.tw | Privacy and Security Policy
Last Updated: 2016-11-28 | Contact: web
