|
Home \ Science \ Scientific Highlights
Scientific Highlights with the SMAMagnetic Field Strength Maps
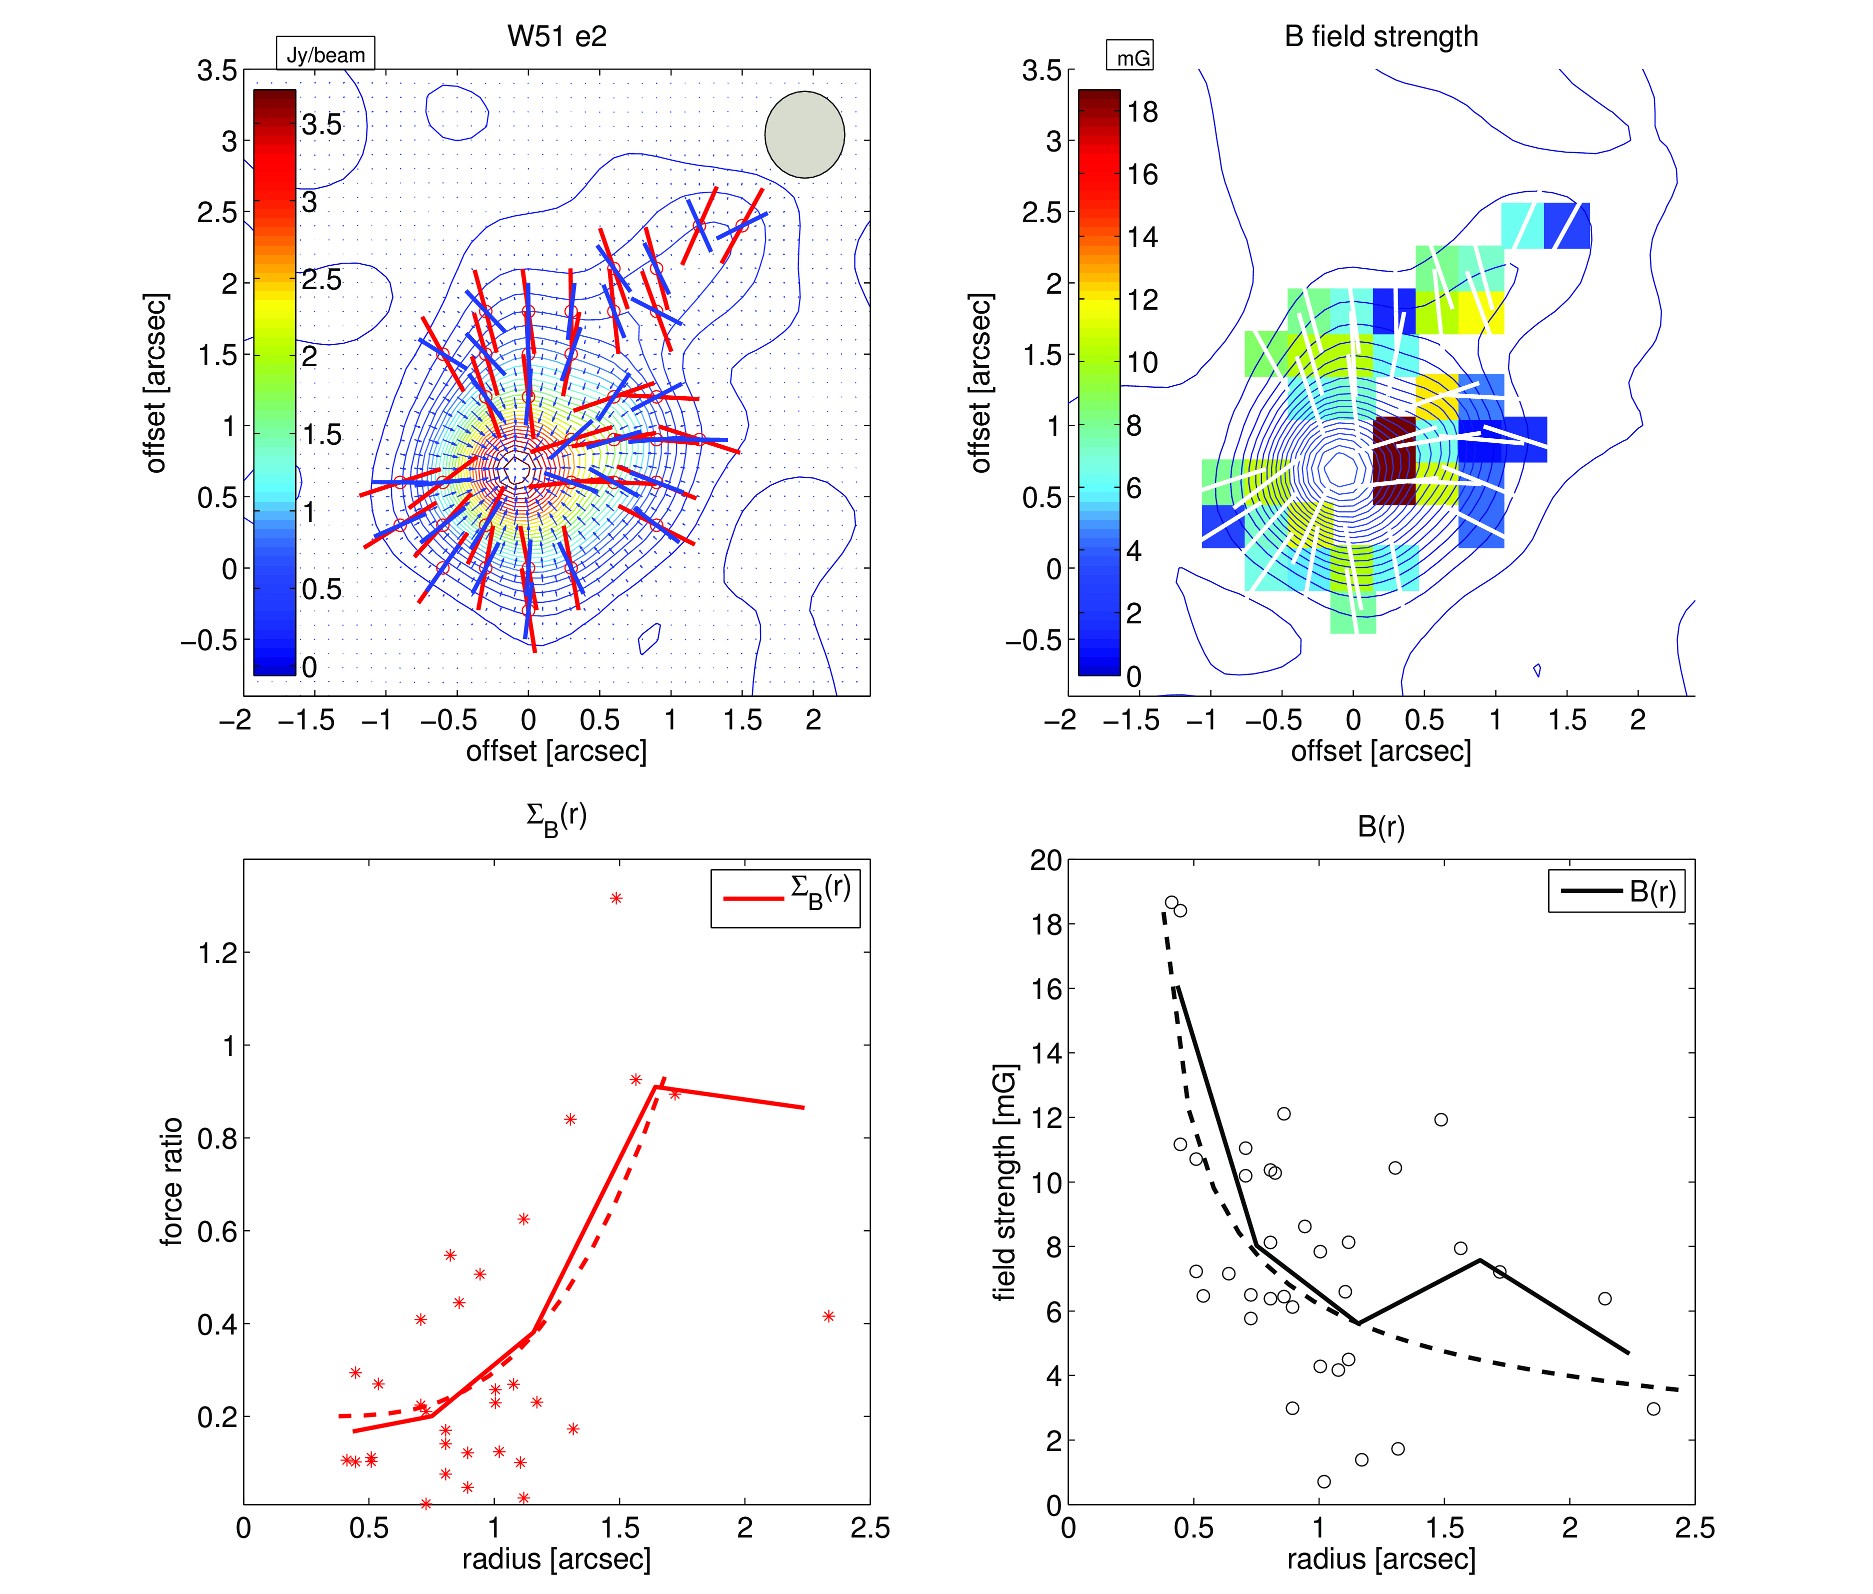
Local magnetic field strength with the polarization - intensity gradient method: the molecular cloud core W51 e2, SMA extended array data (Tang et al. 2009(ADS), Koch et al. 2012a(ADS),b(ADS)). Top left panel: dust Stokes I emission contours. Overlaid are magnetic field (red) and intensity gradient orientations (blue). A clear correlation in orientation is apparent. The synthesized beam resolution is shown in the upper right corner.The top right panel shows the local field strength derived with the polarization - intensity gradient method. Units are in mG. The white segments represent the field orientations. The lower panels show the force ratio and the field strength as a function of distance from the dust emission peak. The solid lines show azimuthally bin-averaged values, with a best fit power law in dashed lines. A clear decrease in the field to gravity force ratio, ΣB, and a clear increase in the field strength, B(r), toward the center are visible. Every open black circle (lower right panel) corresponds to a field strength measurement in the top right panel. |
>> INTERNAL DOCU | ASIAA

©2014, Institute of Astronomy and Astrophysics, Academia Sinica, All Rights Reserved.
Last Updated: 2014-05-10 | Contact: web asiaa.sinica.edu.tw | Privacy and Security Policy
Last Updated: 2014-05-10 | Contact: web
