|
Home \ Science
Recent Science HighlightsMulti-epoch SMA observations of the L1448C(N) protostellar jetProtostellar jets/outflows are considered to be playing an important role in mass accretion from circumstellar disk to central protostar. L1448C(N), a class 0 protostar, is driving archetypical jets and outflows. In order to study physical parameters as well as variabilities of the jets/outflows, we observed the L1448C(N) in SiO J=8-7 and CO J=4-3 lines for three epochs with SMA. Thanks to the high spatial resolution, proper motions of ‘’knots’’ in the jets were detected, which allowed us to determine the inclination angles and 3D velocities. Given the inclination angles, the mass-loss rate and mechanical power were refined. Moreover, we found possible variability of the jet knots in a short timescale (~10 yr). (see Yoshida et al., 2021, ApJ, 906, 112 for more details).
Counterrotation between the Disk and Protostellar Envelope around the Class I Protostar IRAS 04169+2702With the SMA observations and analyses of the SMA archival data of the Class I protostar IRAS 04169+2702, we have found evidence for counterrotation between the disk and the protostellar envelope. Figure 1 shows that the 13CO (3-2) emission is blueshifted to the northwest and redshifted to the southeast, centered on the position of the dust-continuum emission. The direction of the velocity gradient is perpendicular to the axis of the associated 12CO (2-1) molecular outflow as revealed with the same SMA dataset. The spatial-velocity structure of the 13CO (3-2) emission is consistent with the Keplerian rotation. While the spatial resolution of the SO (65-54) image is worse, the SO emission also traces the same velocity feature. Thus, the 13CO and SO emission trace the Keplerian disk around the protostar. On the contrary, the lower-resolution C18O (2-1) image shows that the redshifted emission is located to the northwest and the blueshifted emission to the southeast, opposite to the central 13CO and SO emission. The velocity gradient as seen in the C18O (2-1) emission is consistent with that of the ~2000 au scale protostellar envelope found by the previous observations. These results imply the presence of counterrotation between the Keplerian disk and protostellar envelope. A schematic picture is shown in Figure 2. Whereas theoretical studies suggest that magnetic fields play a vital role in disk formation from protostellar envelopes, it has been difficult to observationally identify gas motions that are indeed controlled by magnetic fields. The detected counterrotation likely reflects the effect of the magnetic field, and the mechanism to cause the counterrotation is known as “Hall effect”. The follow-up ALMA observations are now ongoing, and we will unambiguously identify the gas motion controlled by the magnetic field and discuss the effect of magnetic field in disk formation. (see Takakuwa, S., Tsukamoto, Y., Saigo, K., & Saito, M. 2018, ApJ, 865, 51 for more details).
SMA Constrains Molecular Gas Content of FRB Host GalaxyFast radio bursts (FRBs) are very bright milli-second duration bursts of radio waves that appear to originate outside the galaxy. FRB 121102 was the first FRB observed to repeat pulses and was subsequently the first FRB to be localized to a host galaxy (see Figure), proving the extragalactic origin of these sources. The host galaxy is a low metallicity dwarf galaxy. The SMA and NOEMA were used to search for molecular gas associated with what appears to be a bright star-forming region co-spatial with the FRB (Bower et al. 2018). The non-detection sets an upper limit on the molecular hydrogen mass consistent with star-formation based estimates. Additionally, the SMA results confirm that the bright persistent radio source associated with the FRB has a spectrum that declines steeply with frequency, consistent with either an AGN or radio supernova explanation.
SMA contributed to find an extremely luminous infrared galaxy at zspec=3.7Galaxies with infrared (IR) luminosity, LIR(8-1000 μm), exceeding 1014L☉ are termed extremely luminous IR galaxies (ELIRGs). ELIRGs are expected to correspond to the peak of an active galactic nucleus and/or star-formation activity, providing the laboratory for understanding the galaxy formation and evolution and connection to their supermassive black holes under an extreme condition. Toba & Nagao (2016, ApJ, 820, 46) performed a systematic ELIRGs survey with the SDSS and WISE, and found an ELIRG candidate (hereafter WISEJ1013+6112). Although its spectroscopic redshift (zspec) is determined by the SDSS to be zspec=3.7, a lack of submillimeter and millimeter data prevented us from estimating accurate LIR of WISEJ1013+6112. In order to pin down its rest-frame far-IR and sub-mm SED, we performed follow-up observations at 870 μm (345 GHz) and 1.3 mm (240 GHz) with SMA (Figure 1). Thanks to adding new data points taken by the SMA, we confirmed that WISEJ1013+6112 is an ELIRG (Figure 2). Also, a high spatial resolution with SMA would rule out the possibility that there are massive foreground galaxies that can act as a lens (see Toba et al. 2018, ApJ, 857, 31, for more details).
|
>> INTERNAL DOCU | ASIAA


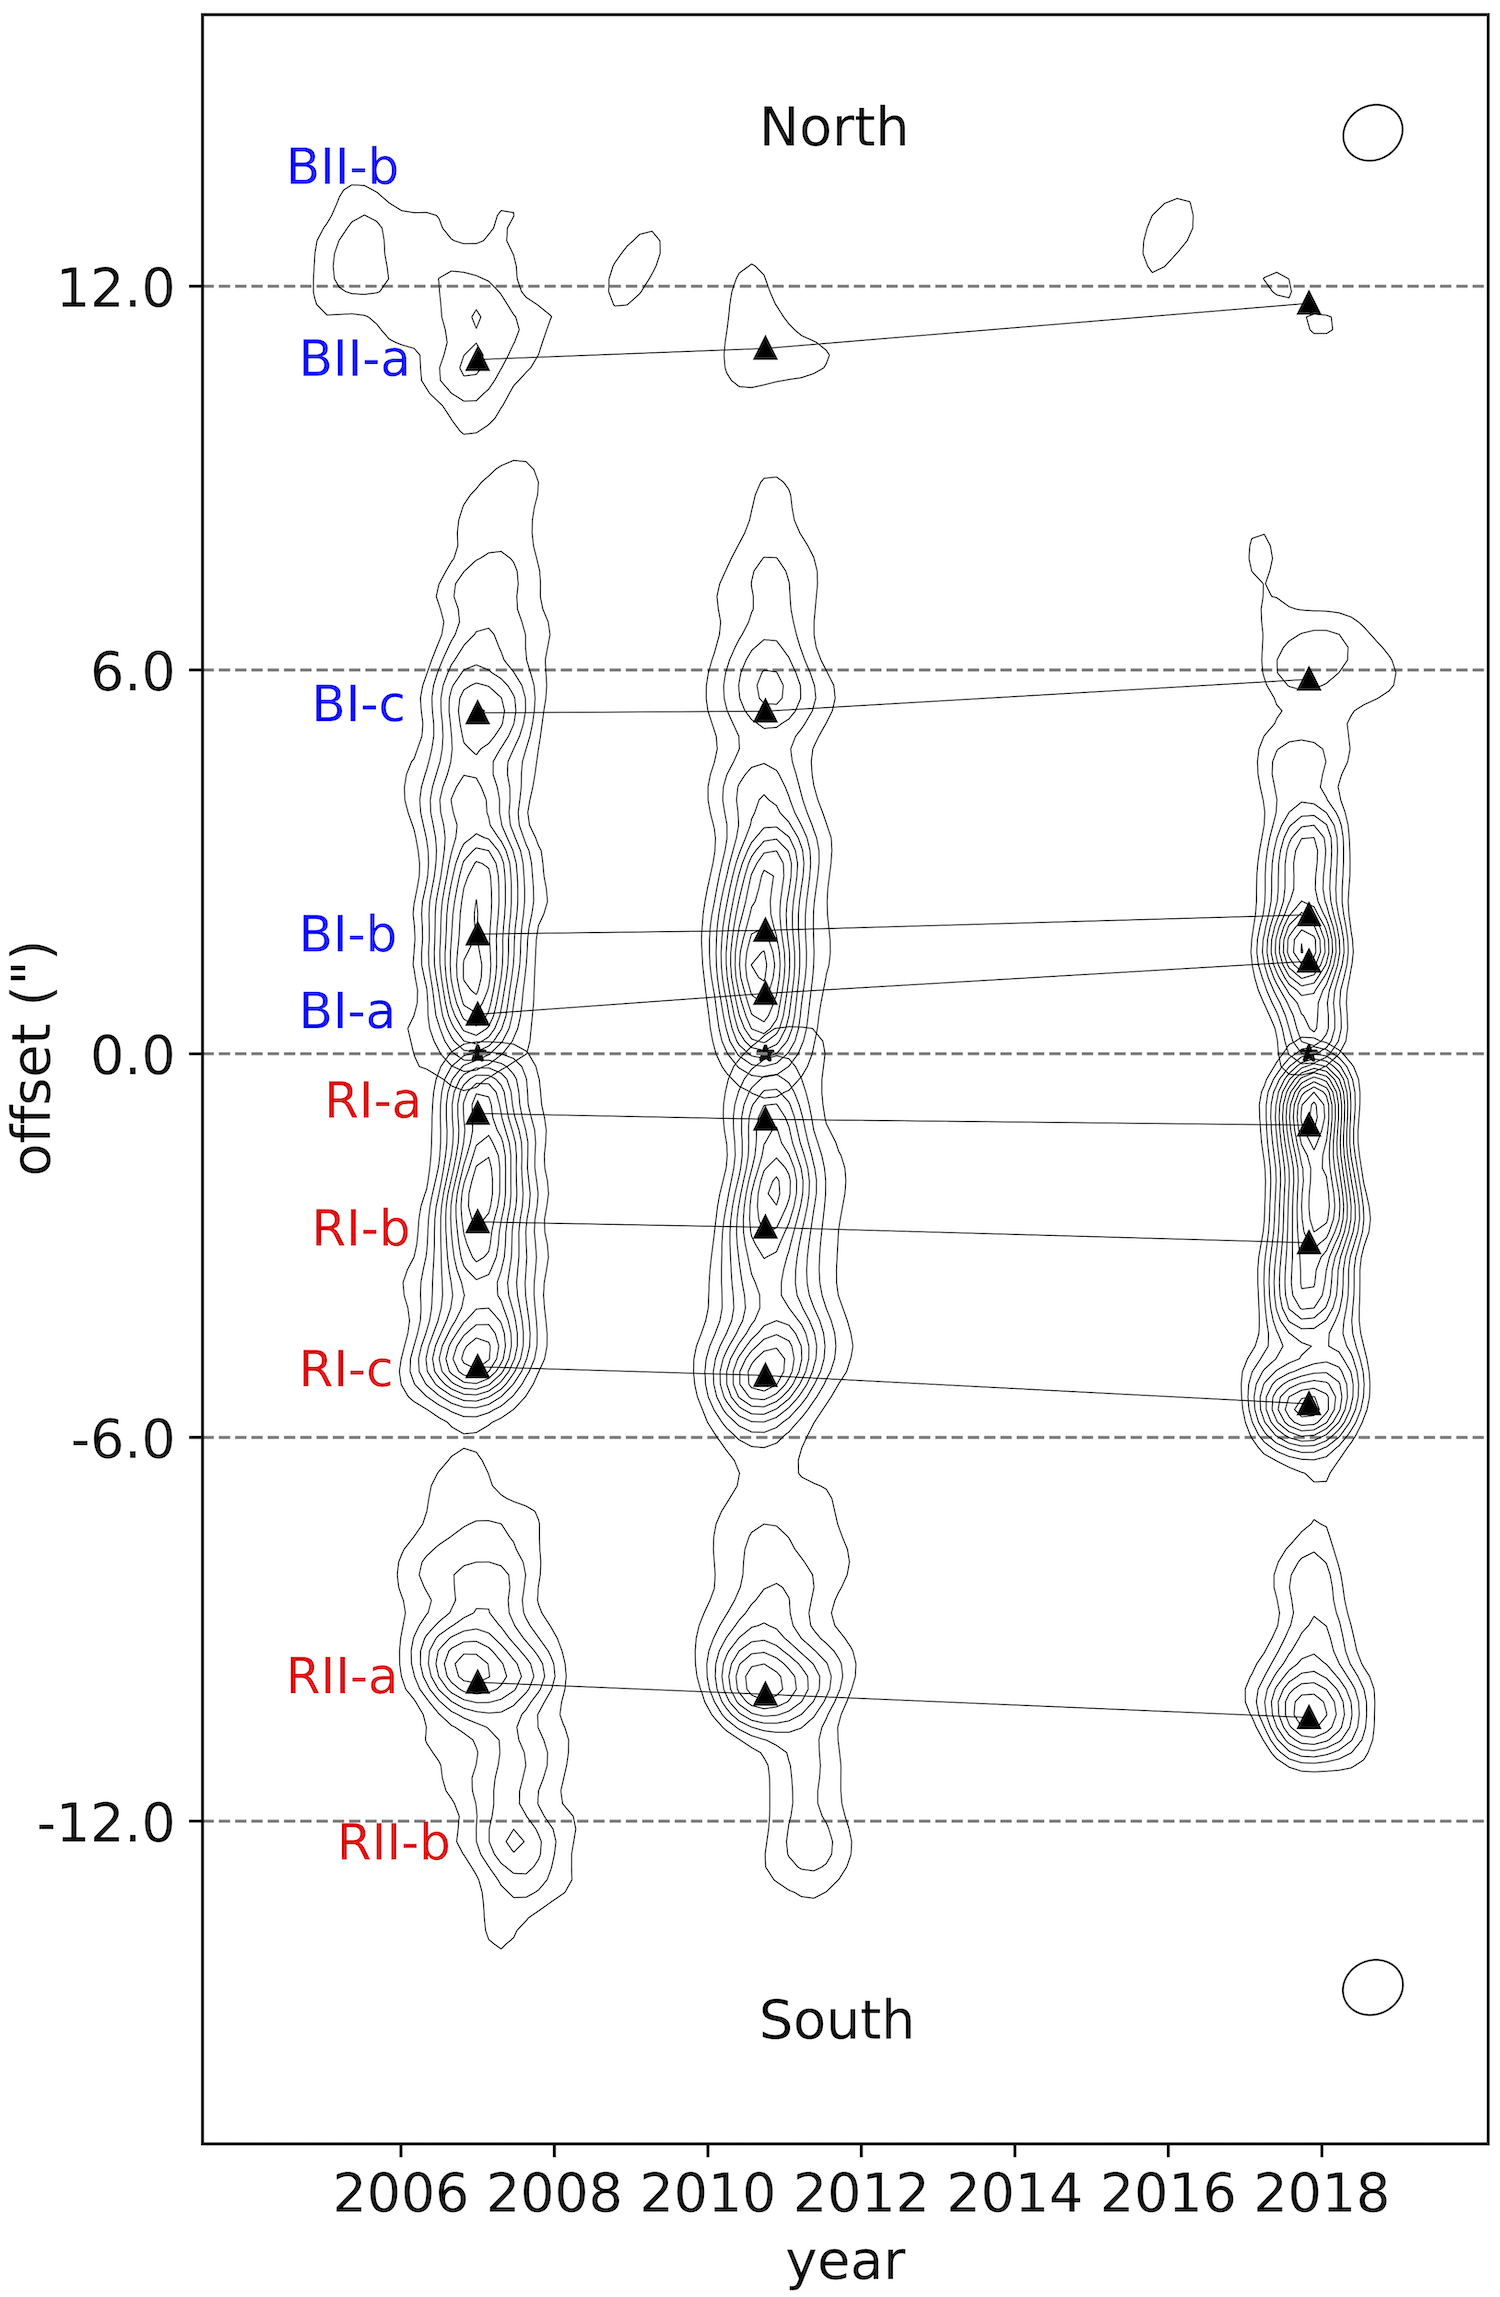 Comparison of the SiO moment 0 maps in the three epochs. The images of the blue- and redshifted jets were rotated to align the jet axes with the vertical line. Each knot is clearly moving toward the downstream.
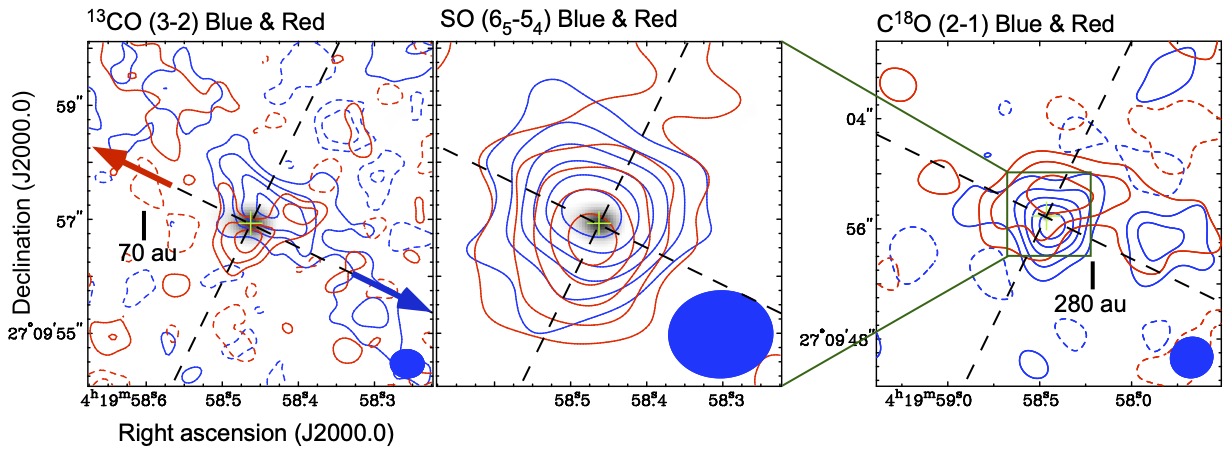 Figure 1: Results of the SMA observations of the Class I protostar IRAS 04169+2702. In each panel, blue and red contours show the distributions of the blueshifted and redshifted emission in the molecular line as labeled. Gray scales show the SMA image of the 0.9-mm dust-continuum emission. Crosses show the position of the protostar, blue and red arrows directions of the blueshifted and redshifted CO outflow, and the filled ellipses at the bottom-right corner the synthesized beams.
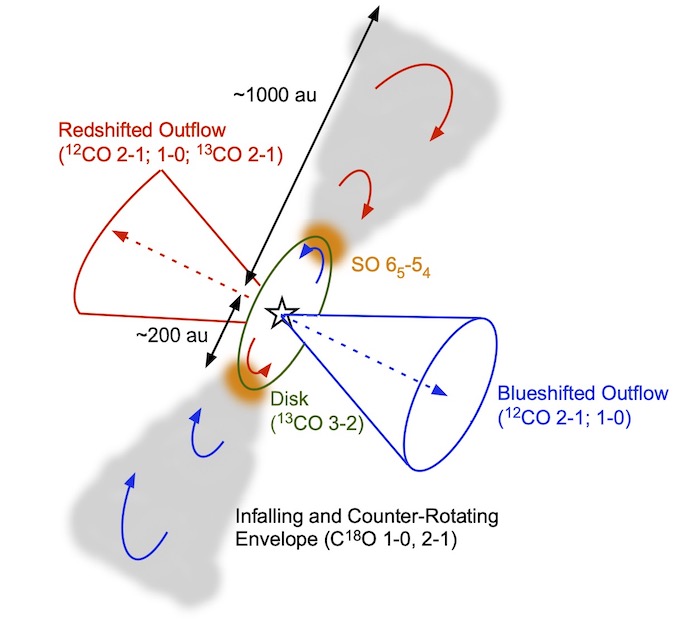 Figure 2: Schematic picture of IRAS 04169+2702 as revealed with the SMA.
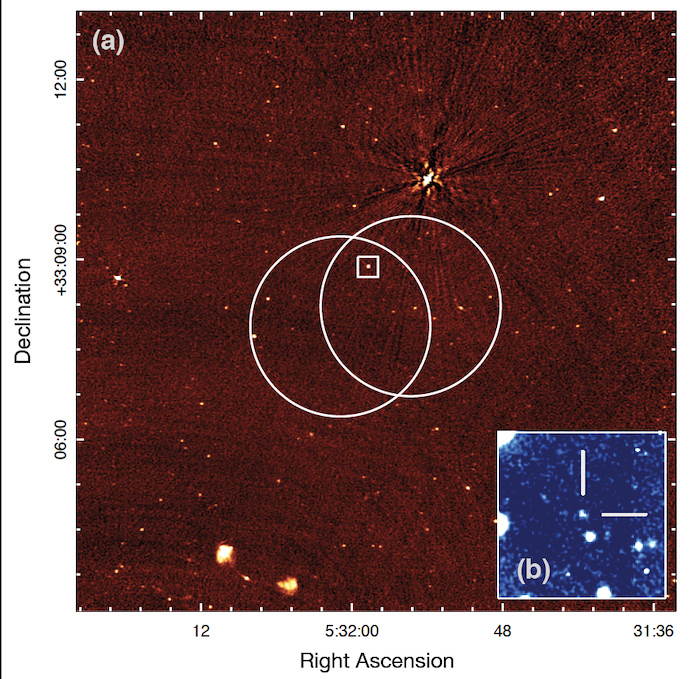 VLA Radio and Gemin optical (inset) image of the host galaxy of FRB 121102 from Chatterjee et al. (2017)
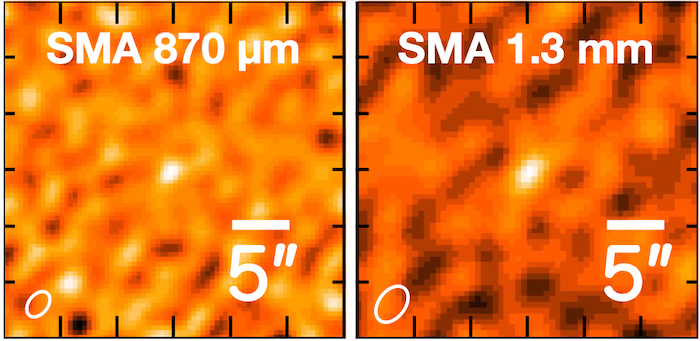 Figure 1. SMA view of WISEJ1013+6112. The white circles on 870 μm (345 GHz) and 1.3 mm (240 GHz) images are beam sizes for SMA.
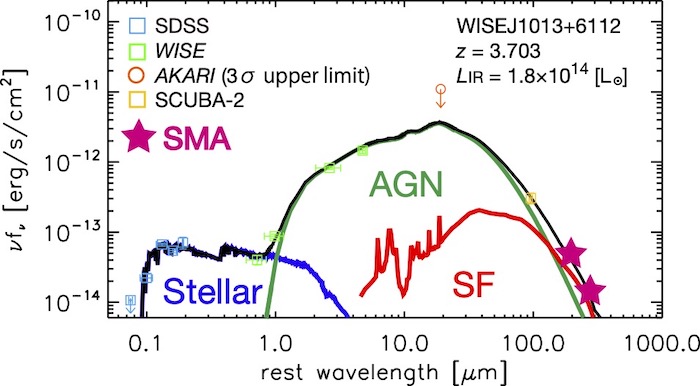 Figure 2. SED of WISEJ1013+6112. The blue, green, orange, and yellow squares represent the data from SDSS, WISE, AKARI (3σ upper limit), and SCUBA-2, respectively. The magenta star represents the data from SMA. The contribution from the stellar, AGN, and SF components to the total SEDs are shown as blue, green, and red lines, respectively. The black solid line represents the resultant SED.
